Reviewing the Project Dashboard
After you have scanned your codebase, a summary of the scan results is displayed in the Project Dashboard. To open the Project Dashboard, click the Load Project Dashboard![]() button on the Projects page. The Project Dashboard lists statistics and charts that summarize the scan results for the selected project.
button on the Projects page. The Project Dashboard lists statistics and charts that summarize the scan results for the selected project.
The following Project Dashboard example shows the combined statistics for the most recent Scan Server scan and the most recent remote scan performed by each scan-agent plugin associated with the project. If only a Scan Server is associated with the project, the dashboard shows the statistics for the most recent scan on the project. If only a single remote scan-agent plugin is associated with the project, the Project Dashboard shows the statistics of the plugin’s most recent scan; or, if multiple scan-agent plugins are associated with the project, the statistics will reflect the combined results of the most recent scan by each plugin. For more information about remote scans, see Other Methods for Accessing a Codebase to Scan.
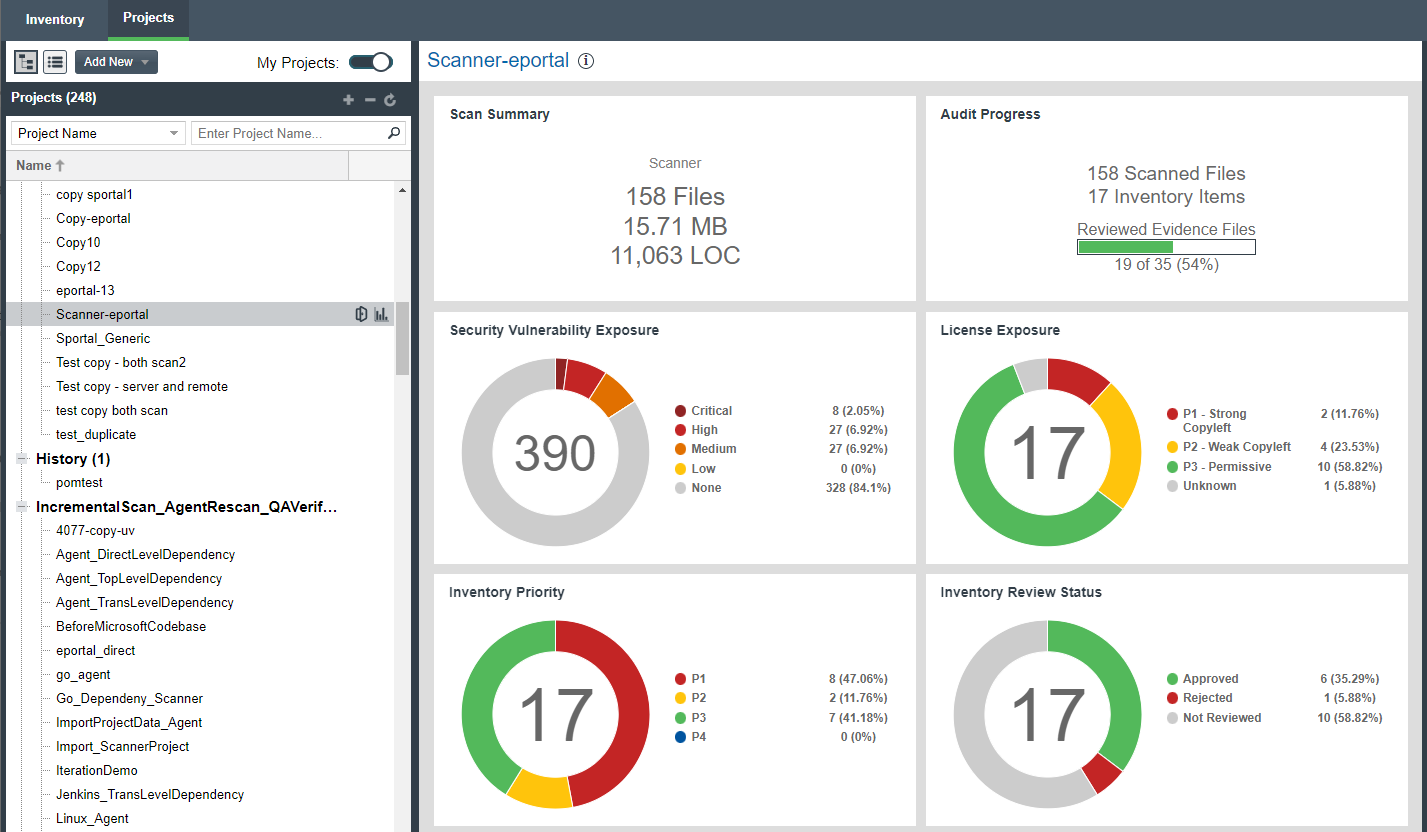
The Project Dashboard includes the following information about the most recent scan on the project:
-
Scan Summary—Lists count and size totals for files scanned in the most recent scan by the Scan Server; or combined totals for the most recent scan performed by each remote scan-agent plugin associated with the project; or a combination of totals for the Scan Server and for the scan-agent plugin(s).
-
Audit Progress—Lists the number of scanned files and inventory items, and percentage of evidence files that have been reviewed.
-
Security Vulnerability Exposure—An interactive color-coded chart and legend that provide an overview of the security vulnerabilities by severity across all the project inventory. The number in the center of the chart is the total number of security vulnerabilities found across all inventory items.
-
License Exposure—An interactive color-coded chart and legend that provide an overview of the licenses identified by priority across all of the project inventory. The number in the center of the chart is the total number of inventory items identified for the current project.
-
Inventory Priority—An interactive color-coded chart and legend that provide an overview of the priority of inventory in the selected project.
-
Inventory Review Status—An interactive color-coded chart and legend that show you the review status (Approved, Rejected, Not Reviewed) of the inventory for the selected project.